You’ve probably Googled something like “how to learn Python for data science” at least twice this week. Maybe more. And you’ve probably landed on articles that give you a list of 47 tools, 12 courses, and three bootcamps — without ever telling you where to actually start.
This is not that article.
This is the guide I wish existed when I was staring at a blank code editor wondering why I even installed Python in the first place. We’re going step by step. No hype. No unnecessary jargon. Just a clear path from zero to writing your first real data analysis.
Let’s get into it.
First, Let’s Kill a Myth: You Don’t Need a Math Degree
The number one reason beginners quit before they start is the belief that data science is only for people with PhDs in statistics or mathematics.
That’s simply not true.
Yes, statistics matters. Yes, you’ll eventually encounter linear algebra and probability. But for 80% of the real data science work done at actual companies — cleaning data, exploring trends, building dashboards, training basic models — you need solid Python fundamentals and the curiosity to keep asking questions.
The math can come gradually. The coding has to come first.
Step 1: Get Python Installed and Running (Day 1)
Before anything else, you need Python on your machine and a place to write code.
Install Python: Go to python.org and download the latest stable version. During installation on Windows, check the box that says “Add Python to PATH” — don’t skip this.
Pick your editor: For data science beginners, Jupyter Notebook or Google Colab is the best starting point. Colab is browser-based and requires zero setup — just a Google account. You can literally start coding in five minutes.
# Your very first line
print("Hello, Data Science!")
That’s it. You’re in. Don’t overthink the setup phase. Spend one hour on it, max.
Step 2: Learn Core Python — Not All of Python
Here’s a trap beginners fall into: trying to learn all of Python before touching data science. You don’t need to. You need to learn the parts that data science actually uses.
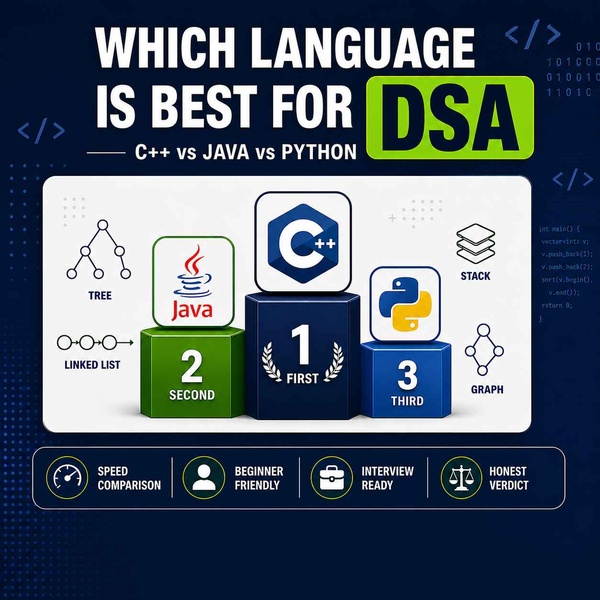
💡 Not sure which programming language to start with? Read our guide on which language is best for DSA before you dive in — it clears up a lot of confusion for beginners.
Focus on these fundamentals over your first two to three weeks:
Variables and data types:
name = "Alice"
age = 28
score = 94.5
is_enrolled = True
Lists and dictionaries — these are everywhere in data work:
students = ["Maria", "Jake", "Lena"]
student_info = {"name": "Maria", "age": 22, "grade": "A"}
Loops — for going through data row by row:
for student in students:
    print(f"Processing: {student}")
Functions — for writing reusable code:
def calculate_average(scores):
    return sum(scores) / len(scores)

result = calculate_average([88, 92, 75, 100])
print(result)  # 88.75
If/else logic:
if score >= 90:
    print("Grade: A")
elif score >= 75:
    print("Grade: B")
else:
    print("Grade: C")
Spend two weeks on these. Practice daily. Build tiny projects — a grade calculator, a contact book, a simple quiz. The goal isn’t memorizing syntax. It’s building the habit of thinking like a programmer.
Step 3: Learn NumPy — The Engine Under the Hood
Once you’re comfortable with basic Python, NumPy is your first data science library.
NumPy (Numerical Python) lets you work with large arrays of numbers extremely fast. Most other data science libraries are built on top of it, so understanding it gives you a foundation for everything else.
import numpy as np

scores = np.array([85, 92, 78, 100, 67, 88])

print(scores.mean())    # 85.0
print(scores.max())     # 100
print(scores.min())     # 67
print(scores.std())     # standard deviation
The key difference from regular Python lists? NumPy arrays are optimized for math. Operations that would take hundreds of lines in plain Python take one line in NumPy.
Give NumPy about one week. You don’t need to master every function — just get comfortable creating arrays, doing basic math on them, and filtering data.
Step 4: Learn Pandas — The Heart of Python for Data Science
This is the big one. If NumPy is the engine, Pandas is the steering wheel.
Pandas lets you work with tabular data — think spreadsheets, CSV files, database tables. It introduces two key structures: the Series (a single column) and the DataFrame (a full table).
import pandas as pd

# Load a CSV file
df = pd.read_csv("students.csv")

# Peek at the first 5 rows
print(df.head())

# Basic info
print(df.shape)        # rows, columns
print(df.dtypes)       # data types of each column
print(df.describe())   # summary stats
Filtering data:
# Show only students with a grade above 85
top_students = df[df["grade"] > 85]
print(top_students)
Handling missing values — real datasets are messy:
df.isnull().sum()           # how many missing values per column?
df["grade"].fillna(0)       # fill missing grades with 0
df.dropna()                 # drop rows with any missing value
Grouping data:
# Average grade by department
df.groupby("department")["grade"].mean()
This is the bread and butter of data analysis. Spend two to three weeks here. Find a free dataset on Kaggle.com — there are hundreds for beginners — and just start exploring. Ask questions of the data. What’s the average? What’s the highest? Which group performs best?
Step 5: Learn Matplotlib and Seaborn — Make It Visual
Numbers in a table tell a story. Charts tell it louder.
Matplotlib is the base charting library. Seaborn is built on top of it and makes beautiful charts with less code.
import matplotlib.pyplot as plt
import seaborn as sns

# Simple line chart
scores = [85, 92, 78, 100, 67]
plt.plot(scores)
plt.title("Student Scores")
plt.xlabel("Student #")
plt.ylabel("Score")
plt.show()
# Seaborn bar chart with a DataFrame
sns.barplot(data=df, x="department", y="grade")
plt.title("Average Grade by Department")
plt.show()
Visualization isn’t just for presentations. It’s how you understand your data. Patterns that are invisible in a spreadsheet become obvious in a chart. Train yourself to always visualize before you conclude.
Step 6: Your First Real Project
At this point — roughly six to eight weeks in — you have everything you need to build something real.
Here’s a beginner project that covers the entire workflow:
Project: Analyze a Netflix Dataset
- Download the Netflix titles dataset from Kaggle (free, no sign-in needed)
- Load it with Pandas
- Answer these questions with code:
- What are the top 10 most common genres?
- How many movies vs TV shows are there?
- Which year had the most titles added?
- What’s the average duration of movies?
- Visualize your findings with Seaborn
- Write a short summary of what you discovered
This single project will teach you more than three weeks of tutorials. You’ll hit errors. You’ll Google things. You’ll figure it out. That’s the job.
Once you’ve finished this project, you’ll naturally want to know what comes next — check out our Full Stack Web Development Roadmap 2026 to see how Python fits into the bigger picture of software development.
Step 7: Introduction to Machine Learning (When You’re Ready)
Once you’re comfortable with the above, machine learning is the natural next frontier. The go-to library is scikit-learn, and the good news is that its API is beautifully simple.
from sklearn.linear_model import LinearRegression
from sklearn.model_selection import train_test_split

# Split data into training and testing sets
X_train, X_test, y_train, y_test = train_test_split(X, y, test_size=0.2)

# Train the model
model = LinearRegression()
model.fit(X_train, y_train)

# Make predictions
predictions = model.predict(X_test)
Don’t rush to this step. A solid understanding of Pandas and data exploration will make machine learning ten times more intuitive when you get there.
🤖 Machine learning is also getting turbocharged by AI coding tools. Check out our comparison of GitHub Copilot vs Cursor AI 2026 to see which tool can speed up your Python workflow the most. And if you want to explore what AI can do beyond coding, our list of Top 10 AI Tools 2026 is worth a read.
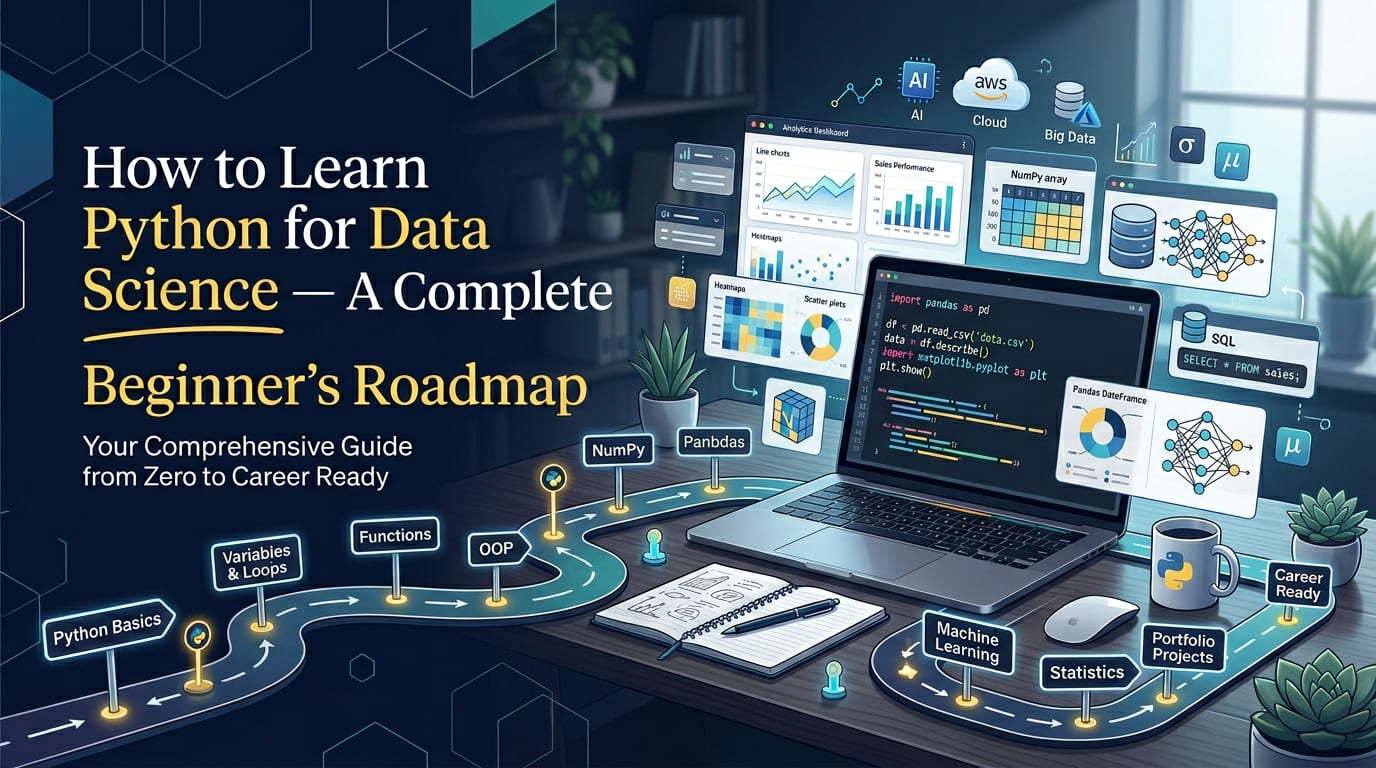
Your 8-Week Python for Data Science Roadmap at a Glance
| Week | Focus |
|---|---|
| Week 1 | Python basics — variables, lists, loops, functions |
| Week 2 | Python practice — build 2–3 small projects |
| Week 3 | NumPy — arrays, math operations, filtering |
| Week 4–5 | Pandas — loading, cleaning, exploring real datasets |
| Week 6 | Matplotlib & Seaborn — data visualization |
| Week 7–8 | Complete your first end-to-end project |
The One Mistake That Kills Most Beginners
Watching tutorials without writing code.
Tutorials feel productive. They’re comfortable. You’re learning, right? But passive watching doesn’t build the muscle memory you need. The moment you close the video and open a blank notebook, you’ll draw a blank.
Rule: For every 30 minutes of tutorial, spend 60 minutes writing code yourself. Break things. Fix them. Change the examples. Make them yours.
Free Resources That Are Actually Good
- freeCodeCamp Python Course (YouTube) — 4 hours, genuinely excellent
- Kaggle Learn (kaggle.com/learn) — free, hands-on, certificate included
- CS50P by Harvard (edx.org) — free, rigorous, beginner-friendly
- Pandas documentation — better than most paid courses once you know the basics
Frequently Asked Questions (FAQ)
Q1: How long does it take to learn Python for data science?
Realistically, if you practice 1–2 hours daily, you can go from zero to doing basic data analysis in 6–8 weeks. Getting comfortable with machine learning takes another 2–3 months. There’s no finish line — every project teaches you something new.
Q2: Do I need to know programming before starting Python?
No. Python is one of the most beginner-friendly languages in the world. Its syntax reads almost like plain English. Thousands of people with zero coding background have learned it successfully. You just need patience and consistency.
Q3: Is Python enough to get a data science job?
Python is the most in-demand language for data science, but employers also look for SQL (for databases), statistics basics, and the ability to communicate your findings clearly. Python gets you 70% of the way there — the rest is practice and projects. Curious about salary expectations? Read our detailed breakdown of software engineer salary in India 2026 to know what to aim for.
Q4: Should I learn R or Python for data science?
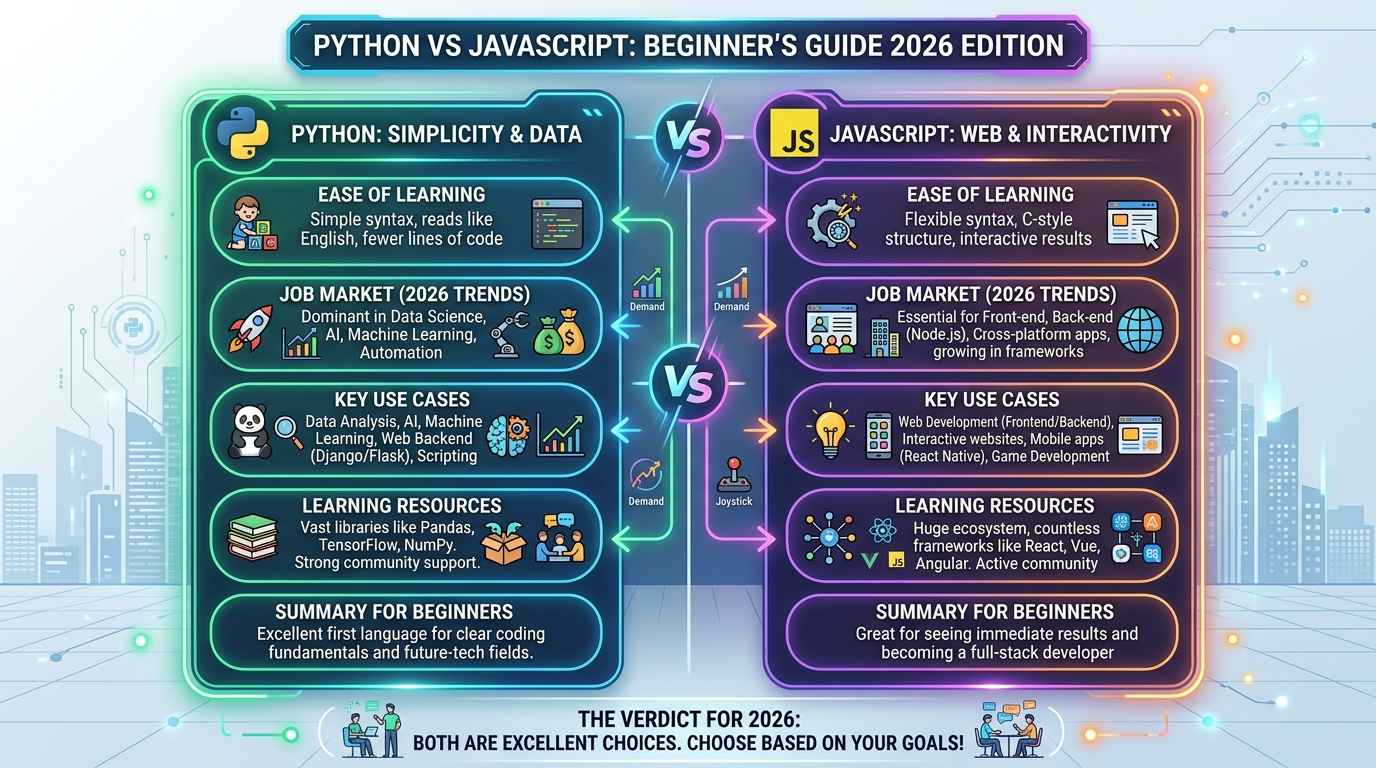
Python, without a doubt. Both are valid tools, but Python has a far larger community, more libraries, and is used across data science, web development, automation, and AI. We’ve covered this debate in depth in our Python vs JavaScript 2026 comparison — and the same logic applies when comparing Python to R. If you ever want to expand beyond data science, Python gives you far more options.
Q5: What’s the best free resource to start learning Python?
Google Colab + Kaggle Learn is the best free combo. Colab gives you a coding environment instantly (no setup), and Kaggle Learn gives you structured, hands-on mini-courses with real datasets. Both are completely free.
Q6: Can I learn Python on my phone or tablet?
Yes — Google Colab works in a mobile browser. It’s not ideal for long coding sessions, but for reading and running small code snippets, it works fine. For serious learning, a laptop or desktop is much better.
Q7: What kind of jobs can I get after learning Python for data science?
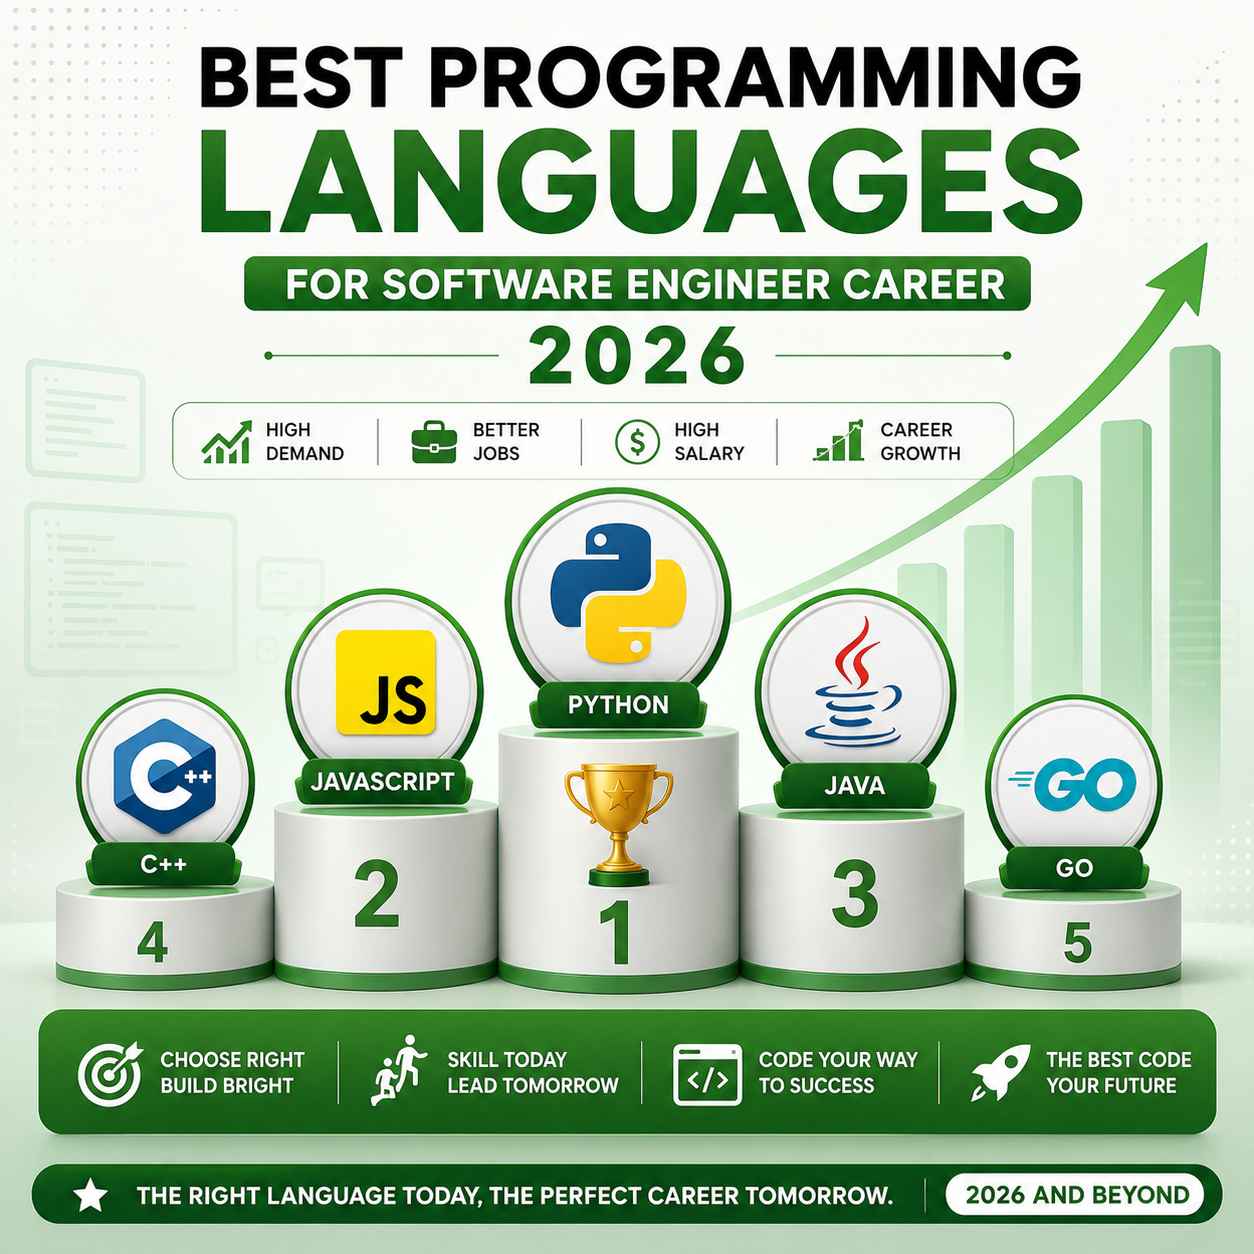
Common entry-level roles include Data Analyst, Junior Data Scientist, Business Intelligence Analyst, and Machine Learning Engineer. Many people also use these skills to add value in their current roles — marketing, finance, operations — without switching careers entirely. If you’re wondering which language is best for software engineering at a broader level, that guide will help you plan your full career path.
Q8: Is data science still in demand in 2025?
Yes, and growing. The rise of AI tools has actually increased demand for people who can work with data — feeding models, cleaning datasets, interpreting results, and building pipelines. Python + data skills remain one of the most employable combinations in tech.
Final Thought
Data science is not a destination you arrive at. It’s a practice you build, day by day, project by project. The people who “make it” aren’t the ones who are naturally gifted — they’re the ones who kept opening the notebook even when nothing worked.
You already took the first step by looking this up.
Now close the tab, open Colab, and write your first line of Python.